Economies of scale
Economies of scale means that production gets cheaper when more units are produced (up to a certain point). The savings come from spreading the cost of production over a larger number of units.[1] The total cost of production divided over this larger number of units leads to a reduction in the average total cost per unit, for example by making more units with the same equipment a firm could potentially double its output without doubling its cost. However, this reduction in cost per unit doesn't continue forever.
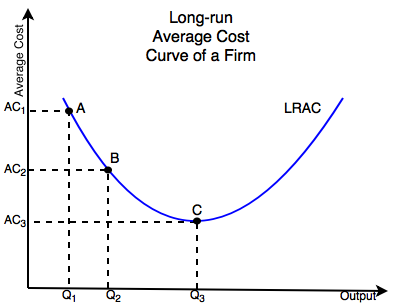
Figure 1 illustrates how a firms average costs change over time:
- The Long Run Average Cost Curve shows how the average costs of a firm evolve over time.
- As the curve slopes down the cost per unit shrinks as seen in the change from point A to point B
- The downward sloping portion of the curve is an economy of scale, the average cost rises proportionately less to output.
- At point C the average cost rises proportionately to output, this is a constant economy of scale
- The upward slopping portion of the curve is called a diseconomy of scale because the average cost rises proportionately faster than output.[2]
If a firm produces 1000 photovoltaic cells per month at a total cost of $50,000 ($50 per unit) and increases its output to 2000 at a total cost of $70,000 ($35 per unit) then the total cost has risen proportionally less than output which means the cost per unit has fallen.
This is the reason why natural monopolies are more efficient in certain circumstances such as municipal water and electricity distribution. It is cheaper and more efficient for one or a few large firms to produce than a large number of smaller firms which would demand a higher price per unit.
Constant Economy of Scale
This occurs when the average cost and output rise proportionally, for example, if the average cost doubles then so does the output. Graphically this is at the minimum of the curve, Point C.
Diseconomy of Scale
When the average cost begins to rise faster than output when in a diseconomy of scale, essentially the opposite of an economy of scale, it is the upward sloping portion of the curve in Figure 1, this happens for a number of reasons.[3] For example, one reason could be space, originally the factory producing the PV cells was large and spacious but as output increased, more and more labourers and machinery was brought in. As the factory continues to increase output past point C, the factory becomes crowded and it becomes harder for labourers to finish PV cells for sale. The factory cannot fit more machinery inside it so labourers have to wait to use machinery resulting in decreased efficiency. This is one example of how an economy of scale is only efficient to a certain point.
See Also
- Monopoly
- Total cost
- Marginal cost
- Fixed cost
- Variable cost
- See how the graph curves compare between this pages and those on the page:
References
- ↑ The Economist. “Economies of Scale.” [Online], Available: http://www.economist.com/economics-a-to-z/e#node-21529486 [May. 29, 2016].
- ↑ R.S. Pindyck and D.L. Rubinfeld. Microeconomics. New Jersey: Pearson, 2013, pp. 255-256.
- ↑ A. Goolsbee, S. Levitt and C. Syverson. Microeconomics. New York: Worth Publishers, 2013, pp. 287.


