Price

The price of a good or service is the amount of money that is paid to obtain it.[2] This is different from cost, which is the value of resources used to achieve an end. Cost includes the values other than money (like time), price is specifically the money paid. Interactions within the market determine the price of a good or service. In addition to market forces, production costs, taxes and other variables have an effect on the price of good or service.
Price at the Pump
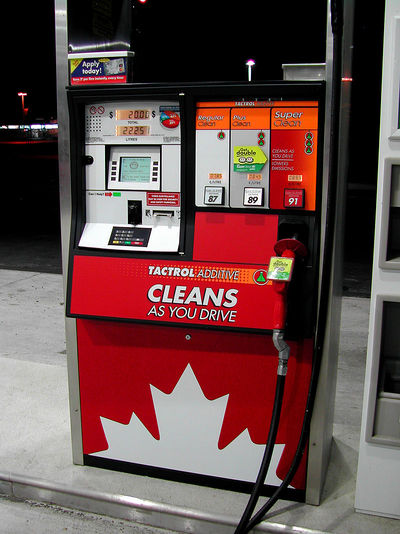
Figure 1 shows a standard gasoline pump. Many factors go into determining the price that a consumer pays at the pump. Assume that a litre of gasoline costs $0.30 to produce, the firm that sells the gasoline wants to make a profit so they increase the price of the gasoline to $0.80. Beyond the cost of producing the gasoline, the firm needs to make profit to pay the owners of the firm (either private or shareholders). In addition to the markup by the firm, both provincial and federal taxes apply to the sale of every litre of gasoline. These taxes are $0.10 and $0.07 respectively, they increase the price of the litre to $0.97. Overtime a consumer puts gas in their vehicle, they pay for the cost of producing the gas, the profit taken by the firm and the taxes that flow to the government.
The firm that produces and sells the gasoline receives $0.80 for the litre and remits the tax amounts to the government on behalf of the consumer. The $0.80 that the firm receives is the total revenue for the litre meaning the amount of money that they received from the consumer. Of that $0.80, $0.50 is profit to the firm that will be given to the owners, the other $0.30 is the cost that it took to produce the gasoline.[3]
Market Forces and Their Effect on Price
Supply and demand are two primary variables that affect the price of a good or service.
Supply

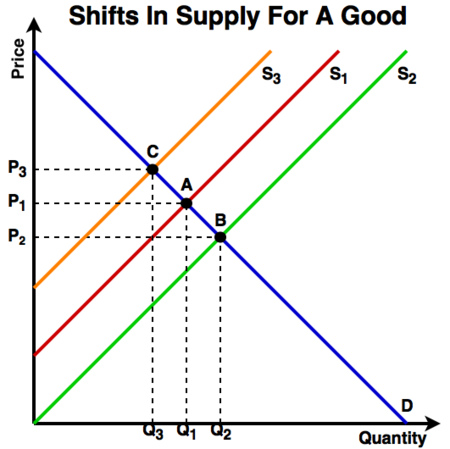
In a market for a good or service, the supply of the good or service helps determine its price depending on how much of the good is available for consumers to buy. The more there is the less it is valued, the less there is, the more its valued. This is called scarcity, the price of a good is partly determined by how scarce a good is. Figure 2 illustrates changes in the level of supply and how they affect the price of a good:
- At Point A the market price of a good is P1 and the quantity supplied to the market is Q1.
- If the supply to the market is increased and the demand (D) for the good stays the same then the price for the good will fall. The price falls because the same number of people are buying the same amount of the good but it is less scarce.[5][6]
- Point B illustrates the increase in supply (S1 to S2), the quantity supplied has risen from Q1 to Q2 and the price for the good has fallen from P1 to P2.
- If the supply to the market is reduced and the demand for the good stays the same then the price for the good will rise. The price rises because the same number of people are buying a smaller amount of the good than before.
- Point C illustrates the reduction in supply (S1 to S3), the quantity supplied has fallen from Q1 to Q3 and the price for the good has risen from P1 to P3.
Demand

Just as the supply for a good or service can influence the price that is paid for consumers, the demand for the good can influence the price. The level of scarcity also affects the demand for a good (depending on what type of good it is, the more scares a good is, the more demand there is:
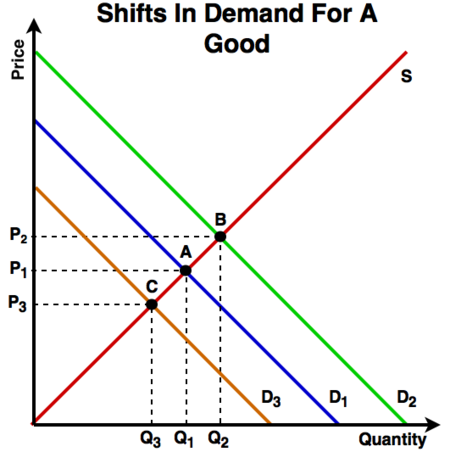
Figure 3 illustrates changes in the level of demand and how they affect the price of a good:
- At Point A the market the price of a good is P1 and the quantity supplied to the market is Q1.
- If the demand in the market for the good is increased and the supply for the good stays the same then the price for the good will rise. The price rises because consumers are buying a larger amount of the good than before, more of the good is supplied to the market to cope with the increased demand.[8][6]
- Point B illustrates the increase in demand (D1 to D2), the quantity supplied has risen from Q1 to Q2 and the price for the good has also risen from P1 to P2.
- If the demand in the market is reduced and the demand for the good stays the same then the price for the good will fall. The price falls because consumers are buying a smaller amount of the good than before, firms adjust the quantity sold to reflect the lower demand.
- Point C illustrates the reduction in demand (D1 to D3), the quantity supplied has fallen from Q1 to Q3 and the price for the good has also fallen from P1 to P3.
Quick Reference Table
This table is a quick reference guide to show how the price and quantity of a good or service in a market react to changes in the demand and supply:[6]
Curve That
Shifts (S or D)Shift
DirectionPrice (P) Quantity (Q) Demand Curve (D) Right (Increase) ↑ ↑ Left (Decrease) ↓ ↓ Supply Curve (S) Right (Increase) ↓ ↑ Left (Decrease) ↑ ↓
For Further Reading
- Supply
- Demand
- Market
- Market force
- Or explore a random page
References
- ↑ Wikimedia Commons. [Online], Available: Public Domain, https://commons.wikimedia.org/w/index.php?curid=187277 [Aug 17, 2016]
- ↑ J.Black, N. Hashimzade, and G. Myles. (2009) "." [Online], Available: http://www.oxfordreference.com/view/10.1093/acref/9780199237043.001.0001/acref-9780199237043-e-2415?rskey=GnOu2R&result=1, 2009 [Aug 27, 2016]
- ↑ Investopedia. "Profit." [Online], Available: http://www.investopedia.com/terms/p/profit.asp[Aug 28, 2016].
- ↑ Created internally by a member of the Energy Education team
- ↑ M. Parkin and R. Bade. Economics: Canada in the Global Environment. Toronto: Pearson, 2013, pp. 64.
- ↑ 6.0 6.1 6.2 A. Goolsbee, S. Levitt and C. Syverson. Microeconomics. New York: Worth Publishers, 2013, pp. 34.
- ↑ Created internally by a member of the Energy Education team
- ↑ M. Parkin and R. Bade. Economics: Canada in the Global Environment. pp. 68.

