Demand
Supply and demand are market forces that interact to determine the price and quantity of goods and services that are bought and sold in a market. Supply is the total amount of a good or service that the producers in a market are willing to sell. Demand refers to the total amount of a good or service that all the buyers in a market are willing to purchase.[1] Both of these forces in the market respond to and together, they shape the price of a good or service in a market.
Demand
Demand is "the ability and desire to buy goods and services, or the quantity of a good or service that is needed in order to meet the requirements of the user."[2] Demand is essentially how much of a good or service will be purchased by buyers in the market at a certain price.
There are a number of factors that influence the level of demand such as:[3]
- The number of consumers.
- The tastes of consumers.
- The wealth or income level of the consumer.
- The price of a good relative to others.
- The price of the good being purchased.
Price
Price is the most influential factor when demand changes because price is often the most important consideration for a consumer when purchasing goods. As prices can be changed easily, it is the factor which can respond to shocks the quickest. While tastes and other factors change over time, it is easy to change the price of an item, an electronic gas station sign can be changed instantaneously for example. Price is important because it is also a factor that the supply side has to respond to. Each one of these factors is able to influence the demand of a market and it is conceivable that they could all act at once but for all intents and purposes it is best to examine the effect that price has on the demand side of a market.
Movement Along the Demand Curve
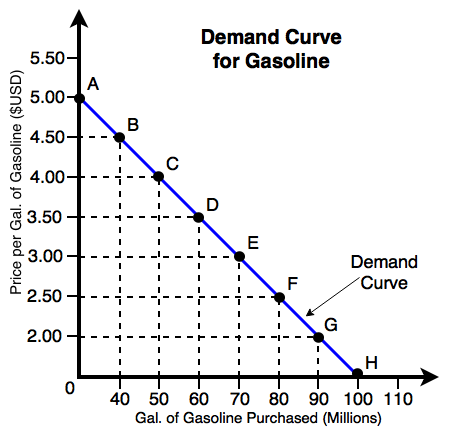
In Figure 1. we can see how the price of a gallon of gasoline affects the amount that is purchased by consumers:
- At point F when the price is $2.50 per gallon there are 80 million gallons of gasoline sold.
- When the price rises to $4.00 at point C consumers are only willing to purchase 50 million gallons of gasoline.
This change indicates the nature of a demand curve, that they are downward sloping, so the cheaper a good is the more it is purchased.
- At point A the price is $5.00 per gallon and the amount purchased by consumers is 0, this is known as the demand choke point. Graphically, it is the vertical intercept of the demand curve.[4] (This means that there is no more demand.)
Shifts in the Demand Curve
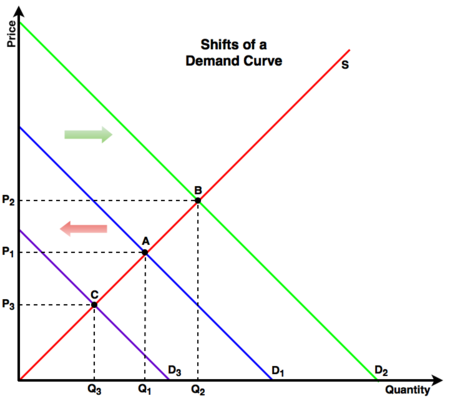
When a demand curve shifts it is as a result of a change in a "non-price" factor relating to demand such as consumer tastes. With the increasing effects of climate change and the realization of the impact that CO2 emissions (among others) has on the environment, consumers may be less likely to purchase gasoline regardless of its price. This change in consumer tastes will shift the entire demand curve, effectively shrinking the market for gasoline:
- In Figure 2, the market as a whole has shrunk (D1 → D3), there is no longer demand for larger amounts of gasoline.
- At Point C the new price (P3) and quantity (Q3) reflect the shift in demand.
- Theoretically no quantity beyond Q3 will be purchased.
The shift in Figure 2. does not represent a total loss in the economy. The decline in the demand for gasoline may result in an increase in the demand for electric cars and the complimentary goods that are needed to operate these vehicles such as batteries and charging stations.
Assume that a family replaces their 2 conventional gasoline powered cars with new electrical cars, in addition to purchasing the cars they have to purchase the home charging station that comes with it and in the future they may have to buy a new battery for the car. Now assume that 50% of residents in a city follow the same trend, the shift from gasoline powered vehicles to electrical will result in an increased demand for electricity and will shift the demand curve for electricity and expand the market for electricity.
- In Figure 2, the electricity market is at Point A.
- As more and more people switch to electric cars the devices needed to operate them, the demand for electricity shifts (D1 → D2).
- The new equilibrium at Point B reflects the new price (P) and quantity (Q2).
- There is a larger amount of electricity needed overall which shifts the demand curve outwards.
See Also
References
- ↑ A. Goolsbee, S. Levitt and C. Syverson. Microeconomics. New York: Worth Publishers, 2013, pp. 15.
- ↑ C. Park. "Demand." Oxford Dictionary of Environment and Conservation. [Online], Available: http://www.oxfordreference.com/view/10.1093/acref/9780198609957.001.0001/acref-9780198609957-e-1950?rskey=WVw7C1&result=1, 2007 [June 23, 2016].
- ↑ A. Goolsbee, S. Levitt and C. Syverson. Microeconomics, pp. 17.
- ↑ "Routledge Dictionary of Economics" choke price published Routledge Press, 2013. Edited by Donald Rutherford Online version accessed [August 17th, 2017].


