Air quality index: Difference between revisions
J.williams (talk | contribs) m (1 revision imported) |
Energy>Jmdonev No edit summary |
||
| Line 1: | Line 1: | ||
[[Category:Done | [[Category:Done 2020-01-31]] | ||
<onlyinclude>'''Air quality index''' ('''AQI''') is a metric developed to communicate levels of [[pollution]] over a given location.</onlyinclude> In a sense they can be looked at similarly to a [[weather]] report, as they inform an individual about the conditions of their [[environment]]. | [[File:SmogNY.jpg|300px|thumb|Figure 1. Smog over New York City.<ref>Wikimedia Commons [Online], Available: https://upload.wikimedia.org/wikipedia/commons/9/96/SmogNY.jpg</ref> This would be an example of a day with a poor air quality index.]] | ||
<onlyinclude>'''Air quality index''' ('''AQI''') is a metric developed to communicate levels of [[pollution]] over a given location.</onlyinclude> Arbitrary numbers are used to describe the risk that air pollution poses at any given moment (see Figure 1). AQI is determined by measuring the concentration of various pollutants such as [[particulate matter]], ground-level [[ozone]], [[carbon monoxide]] and sulphur dioxide.<ref name = oxford>C. Park and M. Allaby, A dictionary of environment and conservation. 2017 </ref> In a sense they can be looked at similarly to a [[weather]] report, as they inform an individual about the conditions of their [[environment]]. However, different countries have their own indices which correspond to differing [[air quality]] standards. This means that a "moderate" level of air pollution in one place might be considered "low-risk" in another. For example, the AQI in Canada is measured from 1-10, whereas in the UK it is measured from 0-500. Therefore, an AQI of 10 in the UK would be "low risk", whereas in Canada it would be considered "very high risk". | |||
[[File:AQI Canada.png|center|800px|thumbnail|Figure 1. The AQI indices in Canada to measure the risk of pollutants for the general population, and at-risk ones.<ref>https://www.canada.ca/en/environment-climate-change/services/air-quality-health-index/understanding-messages.html</ref>]] | |||
*'''[https:// | For the AQI's of different countries, visit the links below: | ||
*'''[https://weather.gc.ca/airquality/pages/index_e.html Canada]''' | |||
*'''[http://www.airnow.gov/ USA]''' | *'''[http://www.airnow.gov/ USA]''' | ||
*'''[http://www.airqualitynow.eu/ Europe]''' | *'''[http://www.airqualitynow.eu/comparing_home.php Europe]''' | ||
*'''[http://aqicn.org/city/all/ Search by city] | |||
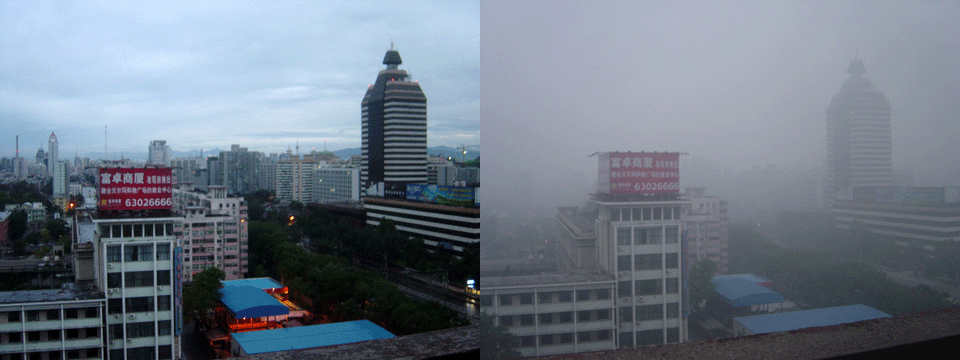
Rain can often dramatically improve air quality as seen in figure 2 below. | |||
[[File:Beijing_smog_comparison_August_2005.png|800px|thumb|center|Figure 2. The air in China after rainfall (left) vs on a smoggy day (right).<ref>Wikimedia Commons [Online], Available: https://upload.wikimedia.org/wikipedia/commons/a/a4/Beijing_smog_comparison_August_2005.png</ref> The air on the left has a considerably better air quality index than the air on the right.]] | |||
==For Further Reading== | |||
*[[Air pollution]] | |||
*[[Air pollution control devices]] | |||
*[[Particulate matter]] | |||
*[[Carbon monoxide]] | |||
*[[Environment]] | |||
*Or explore a [[Special:Random|random page]] | |||
==References== | ==References== | ||
{{Reflist}}[[Category:Uploaded]] | {{Reflist}}[[Category:Uploaded]] | ||
Revision as of 21:00, 19 January 2020

Air quality index (AQI) is a metric developed to communicate levels of pollution over a given location. Arbitrary numbers are used to describe the risk that air pollution poses at any given moment (see Figure 1). AQI is determined by measuring the concentration of various pollutants such as particulate matter, ground-level ozone, carbon monoxide and sulphur dioxide.[2] In a sense they can be looked at similarly to a weather report, as they inform an individual about the conditions of their environment. However, different countries have their own indices which correspond to differing air quality standards. This means that a "moderate" level of air pollution in one place might be considered "low-risk" in another. For example, the AQI in Canada is measured from 1-10, whereas in the UK it is measured from 0-500. Therefore, an AQI of 10 in the UK would be "low risk", whereas in Canada it would be considered "very high risk".

For the AQI's of different countries, visit the links below:
Rain can often dramatically improve air quality as seen in figure 2 below.

For Further Reading
- Air pollution
- Air pollution control devices
- Particulate matter
- Carbon monoxide
- Environment
- Or explore a random page
References
- ↑ Wikimedia Commons [Online], Available: https://upload.wikimedia.org/wikipedia/commons/9/96/SmogNY.jpg
- ↑ C. Park and M. Allaby, A dictionary of environment and conservation. 2017
- ↑ https://www.canada.ca/en/environment-climate-change/services/air-quality-health-index/understanding-messages.html
- ↑ Wikimedia Commons [Online], Available: https://upload.wikimedia.org/wikipedia/commons/a/a4/Beijing_smog_comparison_August_2005.png