McKelvey box
A McKelvey diagram or McKelvey box is a diagram that helps to explore the distinction between occurrences and reserves and the differences that can exist within these two broad categories. Reserves and occurrences are the parameters used to quantify a natural resource. The amount of any natural resource on the Earth can be explained and described in terms of their occurrence and reserves, therefore, it is important to understand what both mean in order to understand how much of this material is accessible and usable.[1]
A McKelvey diagram explores the occurrences and reserves of different materials through the use of two distinct parameters:
- Degree of certainty: how certain it is that the deposit actually exists.[1] If the deposit has been found and accessed, we know it exists to an extremely high degree of certainty. However, if the material is currently being surveyed for, the degree of certainty can be fairly low. The degree of certainty is based on information gained about the geological, physical, and chemical characteristics of a certain material and deposit including the grade or quality of the material, the amount of material in the deposit (or tonnage), the location, and depth of the material.[1]
- Profitability of the deposit.[1] This depends on the amount of money received for this material balanced against the costs of extraction. This parameter can vary widely with upgrades in technology, shifts in world prices, and the level of competition that exists for a certain occurrence. Profitability decreases if the material must be transported long distances.
These two parameters can be changed by other factors such as ownership and permissions needed to access the material. They can be limited by environmental factors such as location within areas that may be environmentally significant
Position on the Diagram
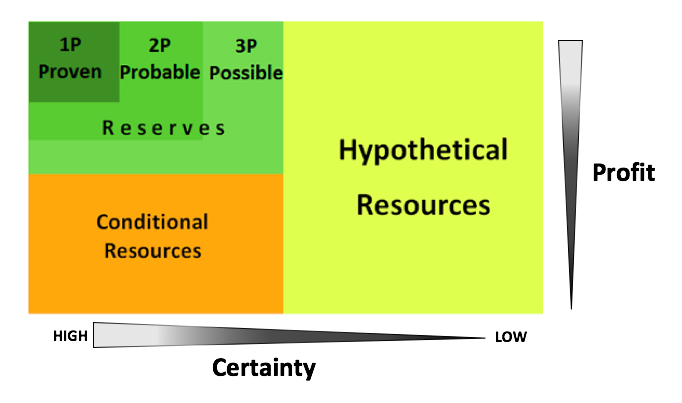
In a McKelvey diagram, the two parameters explained above are used as axes or a box diagram. The entire rectangle represents the entire existing quantity (occurrence) of the given natural resource, such as oil or natural gas.[2] The less certain that a particular deposit exists, the further right that deposit sits on the diagram. The less profitable extracting that deposit is, the lower that deposit sits on the diagram.[1]
The box at the upper left of the diagram represents the reserves of a certain natural resource. These are the deposits which are cost effective to recover and they are known to exist. The entire McKelvey box represents the occurrence of a certain natural resource. The occurrence is all the deposits of a particular natural resource (like oil, or natural gas, but also non-fuel resources like copper) that exist on Earth—discovered/undiscovered and profitable or not.
The bottom of the reserves box is determined by whether or not a firm can make money from extracting that deposit.[1] Any deposit below this line is no longer economically feasible to recover. The right hand side of the reserves box comes from the limits of our knowledge of the deposits. Deposit beyond this line do exist, but there isn't as much confidence as to how much exists, or how hard it would be to extract. For a deposit to be considered a reserve it must have been shown to exist and have been deemed profitable under current conditions. This box can be split into smaller boxes using the 3 P's of reserves:[1]
- Proven (1P): high probability of being economically viable
- Probable (2P): contains proven reserves, and has a medium probability of being economically viable
- Possible (3P): contains both proven and probable reserves and have a lower overall probability of being economically viable
Deposits that have been identified but deemed uneconomic are in a small box on the lower left hand side of the diagram. These natural resources are known as conditional resources.[1] These deposits becomes reserves if they become profitable.
On the right hand side of the diagram are the hypothetical resources which are deposits that are known about minimally or not at all, but could end up being economic when discovered.[1]
Movement between these categories is possible—a conditional resource could become a reserve with improvements to technologies that could make the extraction economic. Conversely, a reserve could become a conditional resource if more restrictions are put on the material or if the price of the material were to fall, making it less economically feasible. Successful exploration could bring hypothetical resources to either reserves or conditional resources.
Use
The McKelvey diagram is a useful way to classify deposits to assess fuel availability. Although in theory the entire occurrence can become reserves eventually, that would never happen in practice. Everything that exists would have to be found and extracted economically. Understanding the outline of the diagram can be used to understand the future coal, oil, and natural gas availability.[2] Many people commonly confuse 'reserve' with the total amount of a natural resource that's available. This idea is closely related to the difference between renewable and sustainable energy.
For Further Reading
- Renewable and sustainable energy
- Fossil fuel
- Fossil fuel formation
- Fossil fuel extraction
- Oil sands
- Hydraulic fracturing
- Or explore a [random page]
References
- ↑ 1.00 1.01 1.02 1.03 1.04 1.05 1.06 1.07 1.08 1.09 G.Boyle, B.Everett, S.Peake, J.Ramage. (May 29, 2015). Energy Systems and Sustainability: Power for a Sustainable Future, 2nd Ed. Oxford, UK: Oxford University Press, 2012
- ↑ 2.0 2.1 Rocky Mountain Institute. (May 29, 2015). McKelvey Diagram [Online]. Available: http://www.rmi.org/RFGraph-McKelvey_diagram_for_coal_gas_resources
- ↑ Created internally by a member of the Energy Education team.


