Pressure volume diagram

The PV diagram models the relationship between pressure (P) and volume (V) for an ideal gas. These diagrams show how work is done on and by an ideal gas. An ideal gas is one that never condenses regardless of the various changes its state variables (pressure, volume, temperature) undergo. [2] The model for PV diagrams assumes that the gas can be treated as a closed system, so there is no exchange of matter, but still an exchange of energy. Often PV diagrams are used for open systems like car engines, by assuming that the same amount of gas comes in every cycle and can't be distinguished from the previous gas.
Pressure and volume change together, the change of one variable will cause a change in the other. To understand how pressure directly affects volume (and vice versa)—imagine a sealed container, containing an ideal gas (the system), that has a moving piston. If a force is applied, the piston moves down, and the gas would compress—decreasing the volume in the system and causing an increase in pressure. Moreover, if the piston moves up, the volume of the system would increase, decreasing the pressure of the system. Therefore, an increase in one variable will cause a decrease in the other, and vice versa. However, if an increase (or decrease) in pressure and/or volume is desired, an external heat source (or a cooling source) from its surroundings must be added.
In addition, these diagrams not only model the relationship between pressure and volume for an ideal gas, but can also be used to calculate work done (on or by the system) - how much energy the system takes in or gives off. This is done by calculating the negative of the area under the curve which can be done geometrically or by integration.[2] The general formula to calculate work done by an ideal gas is the integral:[2]
where:
: means that work is being done on the system (compression)
: means that work is being done by the system (expansion)
: no work is done (isochoric process—see figure below)
The fundamental thermodynamic processes modelled on PV diagrams (isochoric, isobaric, and isothermal processes) all follow the ideal gas law except for adiabatic processes—which will be discussed in detail on its main page. The following are the examples of each process modelled on the PV diagram. Each of their pages will describe their unique characteristics in detail:
- Four main ideal gas law processes modelled on PV diagrams
 Isobaric Process:
Are occurrences when the volume of the system is changing (induced by external heating or cooling sources) but pressure is kept constant.<ref Name=int>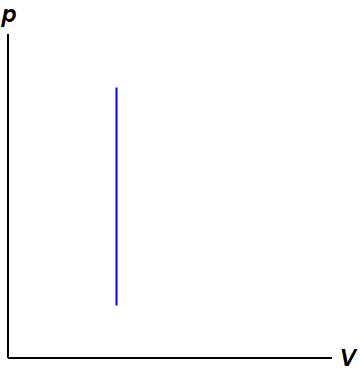 Isochoric Process:
This models a system where the volume stays constant (ex. locking the piston in place) but pressure is changing. This will require an external heating/cooling source to increase/decrease pressure.<ref Name=int>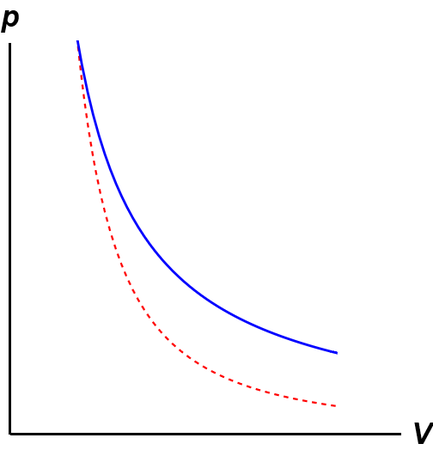 Isothermal Process:
This diagram shows how a fixed amount of ideal gas changes pressure and volume while maintaining a constant temperature. The blue line represents the isothermal, while the steeper dashed line (--) is an adiabat. This process is possible because heat is being exchanged with its surroundings.<ref Name=int>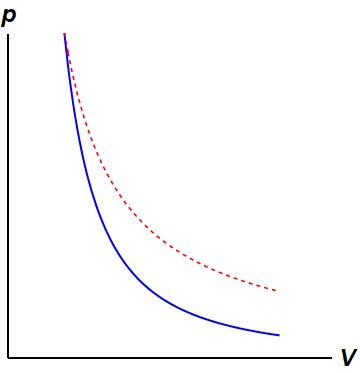 Adiabatic Process:
Similar to an isothermal process at first glance, adiabats represent an ideal gas exhibiting a change in temperature, because there is no heat exchange between the system and surroundings. The steeper blue line represents an adiabat, while the dashed line (--) is an isotherm.<ref Name=int>


Applications of the PV diagram
The various processes seen above can be combined to create cycles found in most internal and external combustion engines. These diagrams are showing how pistons in engines (powered by fuel) or the various processes in a power plant, change the volume and pressure of a working fluid (ex. steam water for turbines, fuel-air mixture for engines) to create work. Then this work can be used to create electricity or move a vehicle. The work done would be calculated by finding the area inside the closed cycle.
The following are the main cycles used in various power plants and transportation mechanisms:
- Four common PV cycles
![This is used in some automobiles and machines that use gasoline as fuel[2].](https://energyeducation.ca/wiki2develop/images/thumb/9/95/Otto_Cycle.png/120px-Otto_Cycle.png) This is used in some automobiles and machines that use gasoline as fuel[2].
This is used in some automobiles and machines that use gasoline as fuel[2].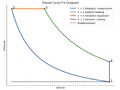 This process is for vehicles and machines that use diesel as fuel.
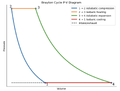 This cycle is used for gas turbine engines and some jet engines.
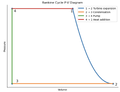 This cycle is widely used by power plants, such as coal-fired power plants or nuclear reactors.
![This is used in some automobiles and machines that use gasoline as fuel[2].](/encyclopedia/File:Otto_Cycle.png)


For Further Reading
- Ideal gas law
- Diesel engine
- Gasoline engine
- Or explore a random page