Pressure volume diagram: Difference between revisions
m (1 revision imported) |
2dev>Jmdonev No edit summary |
||
| Line 1: | Line 1: | ||
[[Category:Done 2018- | [[Category:Done 2018-12-10]] | ||
<onlyinclude>The '''PV diagram''' models the relationship between [[pressure]] (P) and [[volume]] (V) for an [[ideal gas]]. An ideal gas is one that never condenses regardless of the various changes its [[state variable]]s (pressure, volume, [[temperature]]) undergo. <ref name = knight> R. Knight, Physics for scientists and engineers, 2nd ed. San Francisco: Pearson Addison Wesley, 2008, p. 491. </ref> In addition, the processes plotted on PV diagrams only work for a closed [[system]] (in this case the ideal gas), so there is no exchange of matter, but still an exchange of energy.</onlyinclude> | <onlyinclude>The '''PV diagram''' models the relationship between [[pressure]] (P) and [[volume]] (V) for an [[ideal gas law|ideal gas]]. An ideal gas is one that never condenses regardless of the various changes its [[state variable]]s (pressure, volume, [[temperature]]) undergo. <ref name = knight> R. Knight, Physics for scientists and engineers, 2nd ed. San Francisco: Pearson Addison Wesley, 2008, p. 491. </ref> In addition, the processes plotted on PV diagrams only work for a closed [[system]] (in this case the ideal gas), so there is no exchange of matter, but still an exchange of energy.</onlyinclude> | ||
Pressure and volume exhibit a causal relationship, meaning that the change of one variable will cause the change in the other. To understand how pressure directly affects volume (and vice versa)—imagine a sealed container, containing an ideal gas (the system), that has a moving [[piston]]. If a [[force]] is applied, the piston moves down, and the gas would compress—decreasing the volume in the system and causing an increase in pressure. Moreover, if the piston moves up, the volume of the system would increase, decreasing the pressure of the system. Therefore, an increase in one variable will cause the decrease in the other, and vice versa. However, if an increase (or decrease) in pressure and/or volume is desired, an external heat source (or a cooling source) from its surroundings must be added. | Pressure and volume exhibit a causal relationship, meaning that the change of one variable will cause the change in the other. To understand how pressure directly affects volume (and vice versa)—imagine a sealed container, containing an ideal gas (the system), that has a moving [[piston]]. If a [[force]] is applied, the piston moves down, and the gas would compress—decreasing the volume in the system and causing an increase in pressure. Moreover, if the piston moves up, the volume of the system would increase, decreasing the pressure of the system. Therefore, an increase in one variable will cause the decrease in the other, and vice versa. However, if an increase (or decrease) in pressure and/or volume is desired, an external heat source (or a cooling source) from its surroundings must be added. | ||
| Line 42: | Line 42: | ||
<gallery caption="Four common PV cycles" mode=slideshow heights= | <gallery caption="Four common PV cycles" mode=slideshow heights=100px> | ||
File:Otto PV cycle.png|'''[[Otto cycle]]''': <br/> This is used in some automobiles and machines that use gasoline as fuel. <ref> | File:Otto PV cycle.png|'''[[Otto cycle]]''': <br/> This is used in some automobiles and machines that use gasoline as fuel. <ref>Made internally by a member of the Energy Education team</ref> | ||
File: | File:brayton-cycle-crop.JPG| '''[[Brayton cycle]]''': <br/>This cycle is used for gas turbine engines and some jet engines. <ref>Made internally by a member of the Energy Education team </ref> | ||
File:Diesel | File:Diesel-cycle-crop.JPG| '''[[Diesel cycle]]''': <br/> This process is for vehicles that use diesel as fuel. <ref> Made internally by a member of the Energy Education team</ref> | ||
File:Rankine | File:Rankine-cycle-crop.JPG| '''[[Rankine cycle]]''' <br/> This cycle is widely used by power plants, such as [[Coal fired power plant|coal-fired power plants]] or [[Nuclear reactor|nuclear reactors]]. <ref>Made internally by a member of the Energy Education team </ref> | ||
</gallery> | </gallery> | ||
Revision as of 07:23, 17 November 2018
The PV diagram models the relationship between pressure (P) and volume (V) for an ideal gas. An ideal gas is one that never condenses regardless of the various changes its state variables (pressure, volume, temperature) undergo. [1] In addition, the processes plotted on PV diagrams only work for a closed system (in this case the ideal gas), so there is no exchange of matter, but still an exchange of energy.
Pressure and volume exhibit a causal relationship, meaning that the change of one variable will cause the change in the other. To understand how pressure directly affects volume (and vice versa)—imagine a sealed container, containing an ideal gas (the system), that has a moving piston. If a force is applied, the piston moves down, and the gas would compress—decreasing the volume in the system and causing an increase in pressure. Moreover, if the piston moves up, the volume of the system would increase, decreasing the pressure of the system. Therefore, an increase in one variable will cause the decrease in the other, and vice versa. However, if an increase (or decrease) in pressure and/or volume is desired, an external heat source (or a cooling source) from its surroundings must be added.
In addition, these diagrams not only model the relationship between pressure and volume for an ideal gas, but can also be used to calculate work done (on or by the system). This is done by calculating the negative of the area under the curve which can be done geometrically or by integration.[1] The general formula to calculate work done by an ideal gas is the integral:[1]
where:
: means that work is being done on the system (compression)
: means that work is being done by the system (expansion)
: no work is done (isochoric process—see figure below)
The fundamental thermodynamic processes modelled on PV diagrams (isochoric, isobaric, and isothermal processes) all follow the ideal gas law except for adiabatic processes—which will be discussed in detail on its main page. The following are the examples of each process modelled on the PV diagram. Each of their pages will describe their unique characteristics in detail:
- Four main ideal gas law processes modelled on PV diagrams
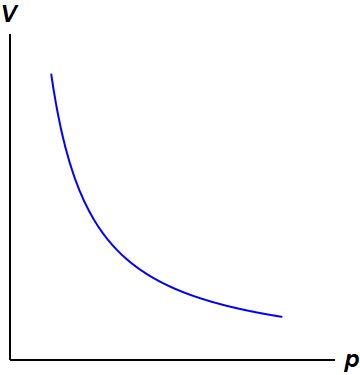
Isothermal Process:
This diagram is showing an ideal gas exhibiting constant temperature. This is possible because heat is being exchanged with its surroundings.[4]


Applications of the PV diagram
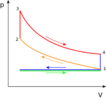
The various processes seen above can be combined to create cycles found in most internal and external combustion engines. These diagrams are showing how pistons in engines (powered by fuel) or the various processes in a power plant, change the volume and pressure of a working fluid (ex. steam water for turbines, fuel-air mixture for engines) to create work. Then this work can be used to create electricity or move a vehicle. The work done would be calculated by finding the area inside the closed cycle (ex. the yellow shaded area of the Rankine cycle below).
The following are the main cycles used in various power plants and transportation mechanisms:
- Four common PV cycles
Otto cycle:
This is used in some automobiles and machines that use gasoline as fuel. [6]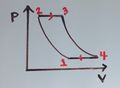
Brayton cycle:
This cycle is used for gas turbine engines and some jet engines. [7]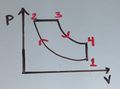
Diesel cycle:
This process is for vehicles that use diesel as fuel. [8]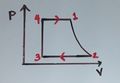
Rankine cycle
This cycle is widely used by power plants, such as coal-fired power plants or nuclear reactors. [9]


References
- ↑ 1.0 1.1 1.2 R. Knight, Physics for scientists and engineers, 2nd ed. San Francisco: Pearson Addison Wesley, 2008, p. 491.
- ↑ Wikimedia Commons [Online], Available: http://wiki.mitsted.dk/?page=Billede:Isobar-proces.png
- ↑ Wikimedia Commons [Online], Available: http://wiki.mitsted.dk/?page=Billede:Isokor-proces.png
- ↑ Wikimedia Commons [Online], Available: https://commons.wikimedia.org/wiki/File:Isothermal_process.svg
- ↑ Wikimedia Commons [Online], Available: https://commons.wikimedia.org/wiki/File:Adiabatic_process.png
- ↑ Made internally by a member of the Energy Education team
- ↑ Made internally by a member of the Energy Education team
- ↑ Made internally by a member of the Energy Education team
- ↑ Made internally by a member of the Energy Education team