Rising sea level: Difference between revisions
m (1 revision imported) |
No edit summary |
||
| Line 1: | Line 1: | ||
[[Category:Done 2016- | [[Category:Done 2016-04-30]] | ||
<onlyinclude>''' | <onlyinclude>Global warming causes a '''rising sea level'''. An increasing amount of [[heat]] is trapped by higher levels of of [[greenhouse gas]]es in the [[atmosphere]]. This heat [[ocean heat|warms the oceans]] and [[ice melt|melts ice]].</onlyinclude> Rising sea levels are one of the main [[concerns about climate change]], and are already measurable. The [[mean sea level]] has increased by about 20 [[centimeter]]s in the past century.<ref name=cc1>M. Melieres and C. Marechal, "The impact of warming on the ocean," in ''Climate Change: Past, Present and Future'' 1st ed., U.K.: Wiley, 2015, ch.27, pp. 273-283</ref> Over the past decade, sea levels have risen at twice the rate compared to the last century.<ref name="RE3"> "Global Climate Change: Coastal Consequences of Sea Level Rise", Climate Change: Vital Signs of the Planet. [Online]. Available: http://climate.nasa.gov/resources/education/pbs_modules/lesson3Engage/. | ||
</ref> | |||
There are two reasons for warming | There are two reasons for a warming planet to increase the mean sea level:<ref name=cc1/><ref name=nasa3>NASA. (Accessed November 7 2015). ''Sea Level Rise'' [Online], Available: http://climate.nasa.gov/climate_resources/125/</ref> | ||
#[[Molecule]]s gain more [[kinetic energy]] at higher temperatures and cause the [[water]] to take up more space. This is known as '''thermal expansion'''. (~1 mm/year) | #[[Molecule]]s gain more [[kinetic energy]] at higher temperatures and cause the [[water]] to take up more space. This is known as '''[[thermal expansion]]'''. (~1 mm/year) | ||
# | #Extra heat causes [[glacier]]s to melt, and that [[water]] flows into the oceans. This matter is particularly worrying because it creates a [[positive climate feedback#Ice-Albedo Feedback|positive feedback cycle]] which amplifies the effect. Continental ice on [[Greenland ice sheet|Greenland]] and west [[Antarctic ice sheet|Antarctica]] is also warming at an accelerated pace, contributing to the rising levels. (~2 mm/year) | ||
Oceans absorb 90% of the trapped heat in global warming and the ice absorbs roughly 3% of the heat, read more about that [[ocean heat|here]]. | |||
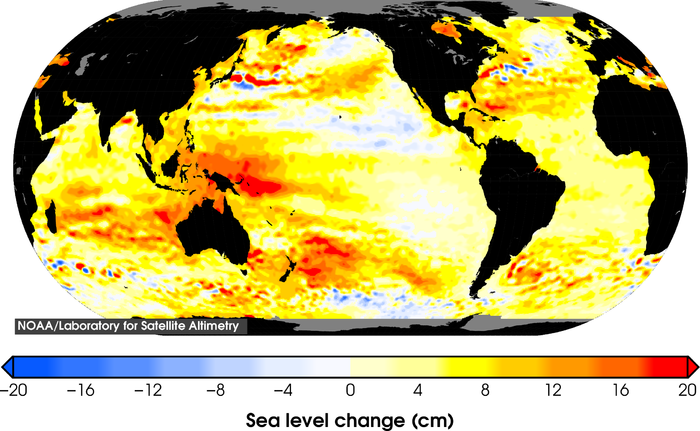
Figure 1 below shows the changing levels of the oceans since 1993. | Figure 1 below shows the changing levels of the oceans since 1993. | ||
[[File:SeaLevel.png|700px|thumb|center|Figure 1. '''Sea level change since 1993'''. Global sea level change is | [[File:SeaLevel.png|700px|thumb|center|Figure 1. '''Sea level change since 1993'''. Global sea level change is not uniform, with some regions are more than 3x the global average. This is due to the variations in thermal structure of the top 1000 m of the ocean.<Ref>NOAA/NESDIS. (Accessed December 28, 2015). ''Sea Level Rise'' [Online], Available: http://www.star.nesdis.noaa.gov/sod/lsa/SeaLevelRise/</ref> ]] | ||
==Consequences== | ==Consequences== | ||
Rapidly rising sea levels rise have devastating consequences on coastal regions. As seawater reaches inland, it can cause destructive [[erosion]] and [[flood]]ing, contamination of [[aquifer]]s (called [[salt water intrusion]]), and loss of habitat for fish, plants, animals and humans.<Ref name=ng>National Geographic. (Accessed January 7, 2016). ''Sea Level Rise'' [Online], Available: http://ocean.nationalgeographic.com/ocean/critical-issues-sea-level-rise/</ref> | |||
When [[extreme weather events]] occur, higher sea levels mean more powerful storms near major cities. Moreover, hundreds of millions of people live in coastal regions that are becoming increasingly vulnerable to flooding.<ref name=ng/> Potential damage as a result of rising sea levels has been studied in detail, and two categories have emerged in terms of which cities will be affected the most: '''highest overall cost of damage''' and '''overall cost as a percentage of [[GDP]]''' (in other words, cities that are poor or have many people, and would be devastated the most by an extreme event).<ref name=wbk/> | When [[extreme weather events]] occur, higher sea levels mean more powerful storms near major cities. Moreover, hundreds of millions of people live in coastal regions that are becoming increasingly vulnerable to flooding.<ref name=ng/> Potential damage as a result of rising sea levels has been studied in detail, and two categories have emerged in terms of which cities will be affected the most: '''highest overall cost of damage''' and '''overall cost as a percentage of [[GDP]]''' (in other words, cities that are poor or have many people, and would be devastated the most by an extreme event).<ref name=wbk/> | ||
==Future Sea Level Rise== | |||
Scientists have predicted possible contributions to sea level rise by the year 2100 of 16 cm - 54 cm from Greenland and 13 cm - 62 cm from Antartica. These values totalled are projected to contribute a sea level rise of approximately 56 cm by the end of the century. Adding in thermal expansion of the ocean, this figure is projected to increase to a range of 50 cm - 80 cm.<ref name="RE2"> B. Meyssignac and A. Cazenave, "Sea level: A review of present-day and recent-past changes and variability", Journal of Geodynamics, vol. 58, pp. 96-109, 2012.</ref> Thermal expansion is projected to contribute more than half of the average rise, but land ice will lose mass rapidly as the century progresses.<ref name="RE4"> Is Sea Level Rising?", National Oceanic and Atmospheric Administration. [Online]. Available: http://oceanservice.noaa.gov/education/pd/climate/factsheets/issea.pdf. | |||
</ref> Sea level rise is set to continue at a faster rate than over the past 40 years.<ref name="RE5"> "Climate Change 2014 Synthesis Report Summary for Policymaker", Intergovernmental Panel on Climate Change, 2014. [Online]. Available: https://www.ipcc.ch/pdf/assessment-report/ar5/syr/AR5_SYR_FINAL_SPM.pdf. | |||
</ref> | |||
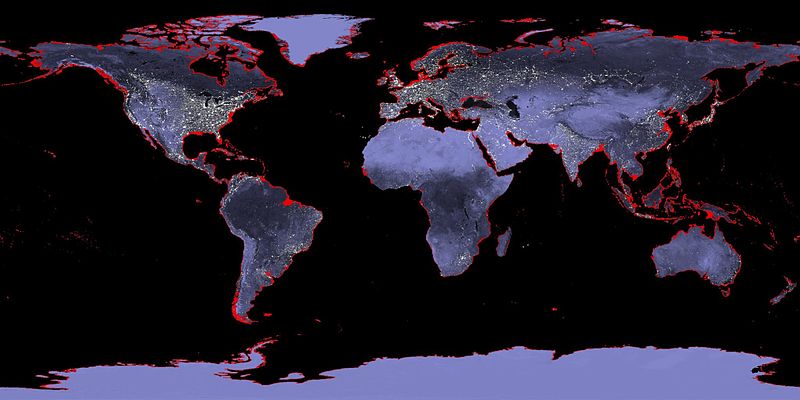
[[File:6m_Sea_Level_Rise.jpg|400px|framed|left|Figure 1. A six-meter sea level rise shown on map of the Earth.<ref>flickr. (May 6, 2016). ‘’Six-Meter Sea Level Rise’’ [Online]. Available: https://www.flickr.com/photos/11304375@N07/6863515730</ref>]] | |||
The 10 cities that are estimated to suffer the '''highest cost of damage''' in the event of such catastrophes are:<ref name=wbk>World Bank. (Accessed December 31, 2015). ''Which Coastal Cities Are at Highest Risk of Damaging Floods?'' [Online], Available: http://www.worldbank.org/en/news/feature/2013/08/19/coastal-cities-at-highest-risk-floods</ref> | The 10 cities that are estimated to suffer the '''highest cost of damage''' in the event of such catastrophes are:<ref name=wbk>World Bank. (Accessed December 31, 2015). ''Which Coastal Cities Are at Highest Risk of Damaging Floods?'' [Online], Available: http://www.worldbank.org/en/news/feature/2013/08/19/coastal-cities-at-highest-risk-floods</ref> | ||
| Line 49: | Line 59: | ||
==References== | ==References== | ||
{{reflist}} | {{reflist}} | ||
[[Category:Uploaded]] | |||
Revision as of 23:54, 24 July 2016
Global warming causes a rising sea level. An increasing amount of heat is trapped by higher levels of of greenhouse gases in the atmosphere. This heat warms the oceans and melts ice. Rising sea levels are one of the main concerns about climate change, and are already measurable. The mean sea level has increased by about 20 centimeters in the past century.[1] Over the past decade, sea levels have risen at twice the rate compared to the last century.[2]
There are two reasons for a warming planet to increase the mean sea level:[1][3]
- Molecules gain more kinetic energy at higher temperatures and cause the water to take up more space. This is known as thermal expansion. (~1 mm/year)
- Extra heat causes glaciers to melt, and that water flows into the oceans. This matter is particularly worrying because it creates a positive feedback cycle which amplifies the effect. Continental ice on Greenland and west Antarctica is also warming at an accelerated pace, contributing to the rising levels. (~2 mm/year)
Oceans absorb 90% of the trapped heat in global warming and the ice absorbs roughly 3% of the heat, read more about that here.
Figure 1 below shows the changing levels of the oceans since 1993.

Consequences
Rapidly rising sea levels rise have devastating consequences on coastal regions. As seawater reaches inland, it can cause destructive erosion and flooding, contamination of aquifers (called salt water intrusion), and loss of habitat for fish, plants, animals and humans.[5]
When extreme weather events occur, higher sea levels mean more powerful storms near major cities. Moreover, hundreds of millions of people live in coastal regions that are becoming increasingly vulnerable to flooding.[5] Potential damage as a result of rising sea levels has been studied in detail, and two categories have emerged in terms of which cities will be affected the most: highest overall cost of damage and overall cost as a percentage of GDP (in other words, cities that are poor or have many people, and would be devastated the most by an extreme event).[6]
Future Sea Level Rise
Scientists have predicted possible contributions to sea level rise by the year 2100 of 16 cm - 54 cm from Greenland and 13 cm - 62 cm from Antartica. These values totalled are projected to contribute a sea level rise of approximately 56 cm by the end of the century. Adding in thermal expansion of the ocean, this figure is projected to increase to a range of 50 cm - 80 cm.[7] Thermal expansion is projected to contribute more than half of the average rise, but land ice will lose mass rapidly as the century progresses.[8] Sea level rise is set to continue at a faster rate than over the past 40 years.[9]

The 10 cities that are estimated to suffer the highest cost of damage in the event of such catastrophes are:[6]
- Guangzhou (China)
- Miami (USA)
- New York (USA)
- New Orleans (USA)
- Mumbai (India)
- Nagoya (Japan)
- Tampa (USA)
- Boston (USA)
- Shenzhen (China)
- Osaka (Japan)
The 10 cities that are most vulnerable, leading to the most devastation include:[6]
- Guangzhou (China)
- New Orleans (USA)
- Guayaquil (Ecuador)
- Ho Chi Minh City (Vietnam)
- Abidjan (Ivory Coast)
- Zhanjiang (China)
- Mumbai (India)
- Khulna (Bangladesh)
- Palembang (Indonesia)
- Shenzhen (China)
The video below by the World Bank discusses this sea level change and its consequences in detail.
References
- ↑ 1.0 1.1 M. Melieres and C. Marechal, "The impact of warming on the ocean," in Climate Change: Past, Present and Future 1st ed., U.K.: Wiley, 2015, ch.27, pp. 273-283
- ↑ "Global Climate Change: Coastal Consequences of Sea Level Rise", Climate Change: Vital Signs of the Planet. [Online]. Available: http://climate.nasa.gov/resources/education/pbs_modules/lesson3Engage/.
- ↑ NASA. (Accessed November 7 2015). Sea Level Rise [Online], Available: http://climate.nasa.gov/climate_resources/125/
- ↑ NOAA/NESDIS. (Accessed December 28, 2015). Sea Level Rise [Online], Available: http://www.star.nesdis.noaa.gov/sod/lsa/SeaLevelRise/
- ↑ 5.0 5.1 National Geographic. (Accessed January 7, 2016). Sea Level Rise [Online], Available: http://ocean.nationalgeographic.com/ocean/critical-issues-sea-level-rise/
- ↑ 6.0 6.1 6.2 World Bank. (Accessed December 31, 2015). Which Coastal Cities Are at Highest Risk of Damaging Floods? [Online], Available: http://www.worldbank.org/en/news/feature/2013/08/19/coastal-cities-at-highest-risk-floods
- ↑ B. Meyssignac and A. Cazenave, "Sea level: A review of present-day and recent-past changes and variability", Journal of Geodynamics, vol. 58, pp. 96-109, 2012.
- ↑ Is Sea Level Rising?", National Oceanic and Atmospheric Administration. [Online]. Available: http://oceanservice.noaa.gov/education/pd/climate/factsheets/issea.pdf.
- ↑ "Climate Change 2014 Synthesis Report Summary for Policymaker", Intergovernmental Panel on Climate Change, 2014. [Online]. Available: https://www.ipcc.ch/pdf/assessment-report/ar5/syr/AR5_SYR_FINAL_SPM.pdf.
- ↑ flickr. (May 6, 2016). ‘’Six-Meter Sea Level Rise’’ [Online]. Available: https://www.flickr.com/photos/11304375@N07/6863515730

