Climate scenario
Climate scenarios are plausible representations of the future climate of the Earth, based on its current observed state and different greenhouse gas emission scenarios.[1] Climate scenarios are useful for investigating potential impacts of anthropogenic climate change. Climate scenarios typically use climate projections, by manipulating model outputs and then combining them with observed climate data. A scenario is any reasonable or probable description of a future state of the world. However, it is not a forecast. Each scenario is one alternative possibility of how the future can unfold. A projection serves as the raw material for a scenario, but scenarios require additional information.
Greenhouse gas (GHG) emissions are the product of complex systems, with exact future emissions nearly impossible to determine. Thus different scenarios are taken into account, each leading to different effects on the climate. The effects of different emission pathways are also subjected to compounding effects, which lead to faster changes on the climate system. This page discusses these effects; for more information on the exact scenarios, please see emission scenarios.
Climate scenarios from RCPs
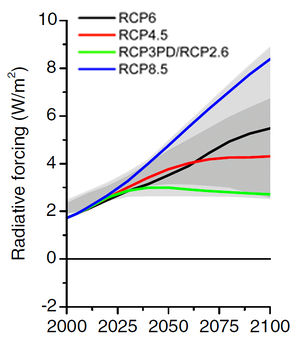
Representative Concentration Pathways (RCPs) are the approach taken towards emission scenarios by the IPCC in their 2014 climate change report. There are 4 pathways each with varying emissions of greenhouse gases up until the year 2100. The effects of these will be discussed here.
The 4 pathways are (shown below):
- RCP8.5 - The high emissions pathway, reaching 8.5 W/m2 of radiative forcing by 2100.
- RCP6 - An intermediate pathway, reaching 6 W/m2 by 2100.
- RCP4.5 - An intermediate pathway, reaching 4.5 W/m2 by 2100.
- RCP2.6 - The low emissions pathway, peaking around 3 W/m2 and then declining to 2.6 W/m2 by 2100.

Global surface temperature
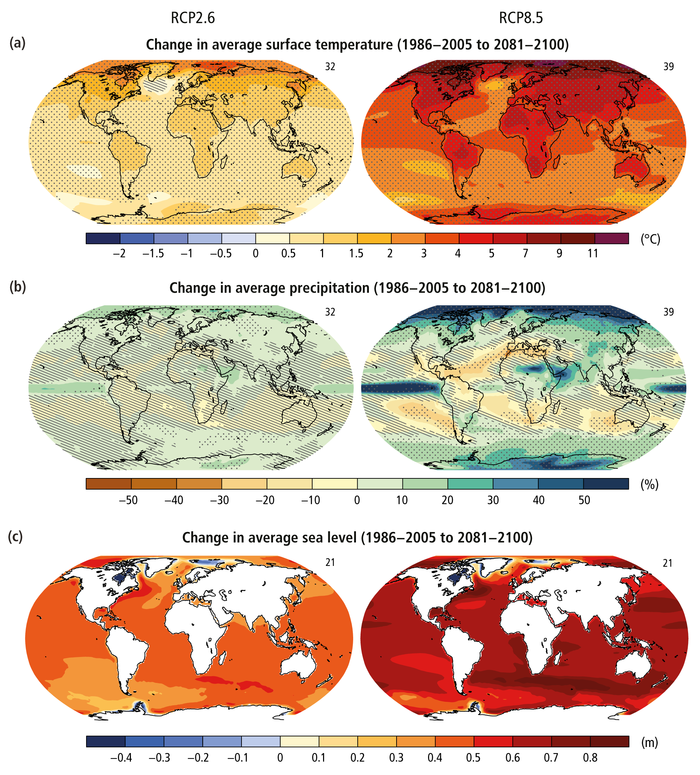
General results: Under all emission scenarios, the temperature of the Earth is projected to rise. The Arctic region will warm more rapidly than the global mean temperature, reported with very high confidence. Warming over land will also occur faster than over ocean, and will exceed the mean global temperature. It is also nearly certain that there will be an increasing frequency of warm days and nights.[3] It is also very likely that heat waves will increase in both frequency and intensity in many regions.
The global mean surface temperature is expected to change similarly for all 4 pathways up until the year 2035, and will likely be in the range of 0.3 - 0.7°C (relative to 2005), assuming no major disruptions in the natural carbon cycle such as a large volcanic eruption.[3] After 2035 however, the pathways begin to diverge up until the year 2100.
Relative to years 1850-1900, the surface temperature change is projected to likely exceed 1.5°C by 2100 for RPC4.5, RPC6 and RPC8.5. It is even likely to exceed 2°C for the RPC6 and RPC8.5 emission scenarios, however this is less likely for the RPC4.5 and unlikely for RPC2.6.
Water cycle
Under RCP8.5: Changes in precipitation will vary drastically for different regions around the Earth. High latitudes and the equatorial Pacific are likely to experience an increase in average annual precipitation in the RCP8.5 scenario. In many mid-latitude and subtropical dry locations, average annual precipitation is likely to decrease, while it is expected to increase in mid-latitude wet regions.[3]
Extreme weather events are very likely to increase in both frequency and intensity as global surface temperatures increase. In all RCPs monsoons are likely to intensify, as well as El Niño related precipitation variability.[3]
Ocean, cryosphere and sea level
The global ocean will continue to warm during the 21st century, for all scenarios. Reductions in Arctic sea ice are also projected for all scenarios. For the RPC8.5 scenario however, the Arctic is projected to be ice-free in the month of September by mid-century.[3]
Northern hemisphere snow cover is projected to decrease by 7% for RCP2.6 and by 25% for RCP8.5 by the end of the 21st century. The global glacier volume is projected to decrease by 15-55% for RCP2.6 and by 35-85% for RCP8.5.[3]
Mean sea level will continue to rise during the 21st century, surpassing the recently observed rate of 2 mm/yr (1971-2010) with the RCP8.5 reaching a rate of 8-16 mm/yr during 2081-2100.[3] See Figure 1 below for the comparison between RCP2.6 and RCP8.5.

References
- ↑ IPCC, 2012: Glossary of terms. In: Managing the Risks of Extreme Events and Disasters to Advance Climate Change Adaptation [Field, C.B., V. Barros, T.F. Stocker, D. Qin, D.J. Dokken, K.L. Ebi, M.D. Mastrandrea, K.J. Mach, G.-K. Plattner, S.K. Allen, M. Tignor, and P.M. Midgley (eds.)]. A Special Report of Working Groups I and II of the Intergovernmental Panel on Climate Change (IPCC). Cambridge University Press, Cambridge, UK, and New York, NY, USA, pp. 555-564.
- ↑ IPCC. (Accessed June 2, 2016). Representative Concentration Pathways (RCPs) [Online], Available: http://sedac.ipcc-data.org/ddc/ar5_scenario_process/RCPs.html
- ↑ 3.0 3.1 3.2 3.3 3.4 3.5 3.6 3.7 IPCC. (Accessed June 2, 2016). AR5 Climate Change 2014 Synthesis Report sec. 2.2, pp.74 [Online], Available: https://www.ipcc.ch/pdf/assessment-report/ar5/syr/SYR_AR5_FINAL_full.pdf#74

